Data Loading and Management
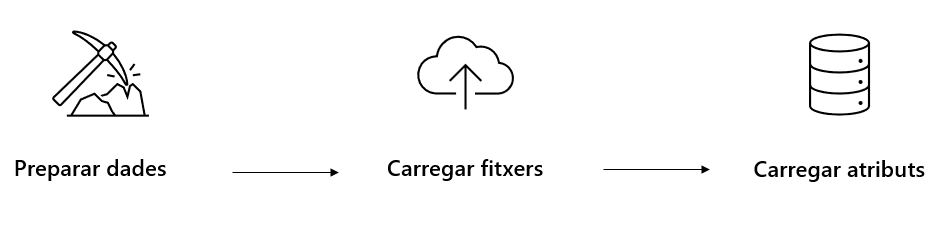
At a general level, data loading is divided into 3 main parts:
- Prepare Data: Optimize, format transformation, geolocalization, merge files, point cloud tessellation, data obfuscation for sensitive data, etc.
- Load Files: Upload files to the server or servers hosting the data (images, point clouds, …)
- Load Attributes: Load data attributes and properties into the database using the Mapia STREETS Manager application
Within Mapia SERVER, the Mapia STREETS module is located within the MSTREETS application:
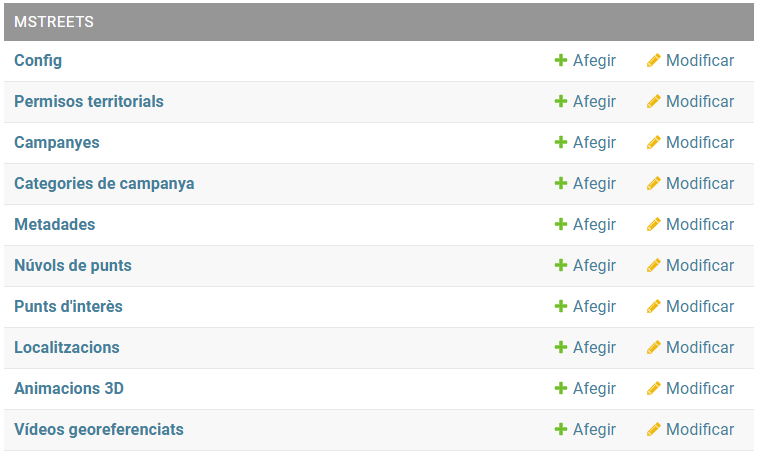
Configurations
Allows adding different initial configurations to the system. If not informed, default values or values defined during installation will be used. We can add the following variables:
- api_url: URL of the MapiaStreets API that manages the application’s data
- api_info_url: URL of the API to obtain additional information about a point or panorama
- folder_poi: Location of points of interest files (panoramas, images, …)
- folder_img: Location of image files
- folder_pc: Location of point cloud files
- page_no_img: Image to display when the panorama file does not exist
- epsg_pc: Coordinate system of the point cloud files
- page_panellum: MapiaStreets panorama view component
- page_potree: MapiaStreets point cloud view component
- radius: Initial search radius in the panorama API
- wms_location: WMS path for application locations
- wms_zone: WMS path for zones
- wms_campaings: WMS path for campaigns
- camera_height: Camera height for panorama capture from the ground (default value: 2.8m)
- hotspots_add: Whether to display hotspots in panoramas or not (default value: true)
- hotspots_dist_min: Minimum distance from which hotspots are shown (default value: 4m)
- hotspots_dist_max: Maximum distance up to which hotspots will be shown (default value: 25m)
- hotspots_height_max: Maximum elevation difference to show hotspots (default value: 3m)
- pc_ini_color: Initial color when visualizing the point cloud. Accepted values: rgba, classification, intensity, elevation
- pc_ini_point_size: Initial point size in the point cloud
- category: Category of elements, used to group elements in lists, e.g., point clouds in the layer list (default value: Data)
Zones
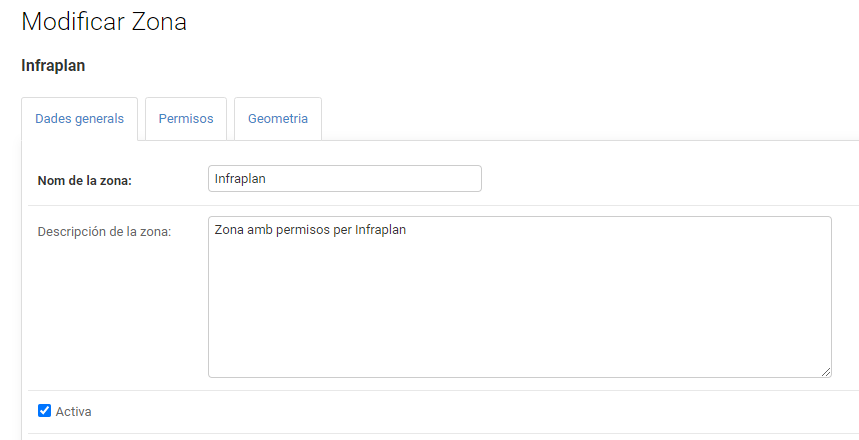
Zones are geographical areas used to grant permissions to users. Each of the campaigns loaded into the system belongs to one or more zones. Each zone contains the following information:
- Name: Zone name
- Active: Whether the zone is active or not. If deactivated, the application will not allow data access
- Permissions: User groups with permissions in this zone (refer to the user management section of this documentation for more information)
- Geometry: Geographic extent of the zone
Information
We can define as many zones as necessary. Zones can be duplicated if different permissions need to be assigned.
Campaign
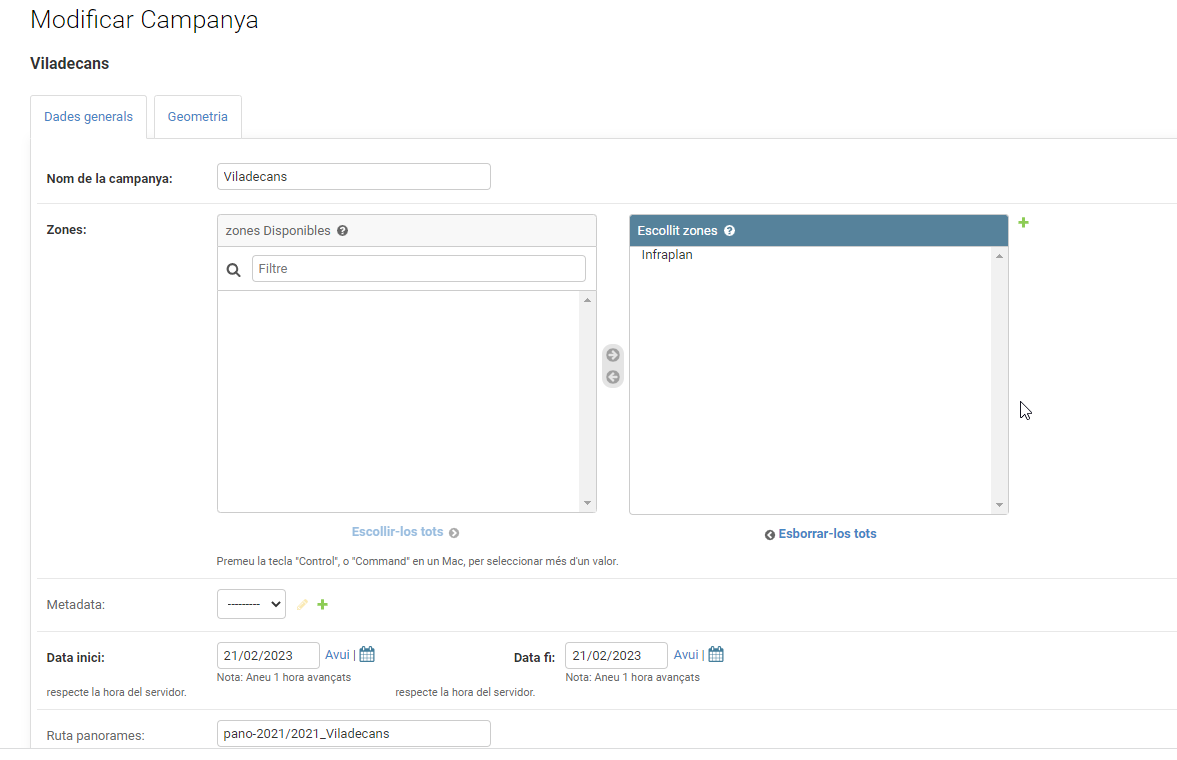
The concept of a campaign corresponds to a data collection field campaign. The campaign contains the following information:
- Campaign Name: Campaign name. It is recommended to indicate the year in the name, e.g., Tarragona 2022
- Zones: Zones in which this campaign should be visible
- Metadata: Metadata of the campaign (see the metadata section)
- Active: Allows deactivating the campaign and making it unavailable in the application
- Start Date: Start date of the campaign. Date only.
- End Date: End date of the campaign. Date only.
- Panorama Path: Full or relative path to the campaign’s panorama files. If it is the same as the main path, it can take a null value.
- Image Path: Full or relative path to the campaign’s image files. If it is the same as the main path, it can take a null value.
- Point Cloud Path: Full or relative path to the campaign’s point cloud files. If it is the same as the main path, it can take a null value.
- Additional Configurations: Allows saving campaign configurations (camera_height, hotspots_add, hotspots_dist_min, hotspots_dist_max, hotspots_height_max, pc_ini_color, pc_ini_point_size, pc_ini_visible, category, pc_order)
- Geometry: Perimeter of the campaign. It does not have to be fully within the zone; there can be a campaign split across two zones with different permissions.
Campaign Perimeter
Alongside the trajectories, but at a different scale within the viewer, the campaign areas are visualised. These appear at a smaller scale. To create these geometries, this is done via the action located within ‘Campaigns’ named ‘Campaign Perimeter Creation’.
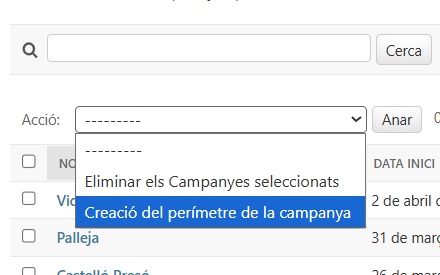
You can select as many campaigns as needed to create the area. The result can be viewed within the campaign in the Geometry section and in the viewer.
However, it is important to have created the trajectories first, as they serve as a starting point.
Metadata
Used to inform about the sensor used in each campaign, operators, etc. It allows storing the following information:
- Sensor: Lidar sensor used
- Precision: (optional) Data precision
- Company: (optional) Company that conducted the campaign or post-processing
- Contact: (optional) Contact information for the data provider
Point Clouds
They are the point clouds visualised from the web. The web point clouds are loaded in Potree format.
The point clouds are loaded into Mapia using the LiDAR data viewer called Potree. To transform the data from LAS format to Potree, PotreeConverter is used. This application can be downloaded by following the link below:
https://github.com/potree/PotreeConverter/releases
Once it is installed, we will run it with the necessary parameters.
PotreeConverter.exe C:\point_cloud.las -o C:\outputFolder –generate-page index
Point_cloud specifies the point cloud input, -o the output folder where the converted files will be stored, generate_page the web format conversion, and index where the point cloud can be visualised. In any case, the files that need to be uploaded to the server are the following:
- .bin
- .txt
- .json
- .bin
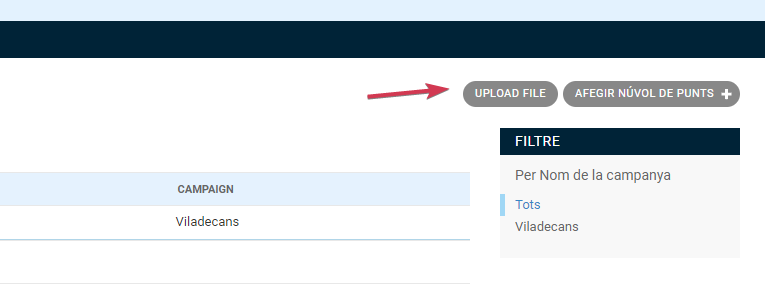
Within Mapia, there are two buttons in the Point Clouds section: Upload File and Add Point Clouds. To add a cloud, you do so via Add Point Clouds.
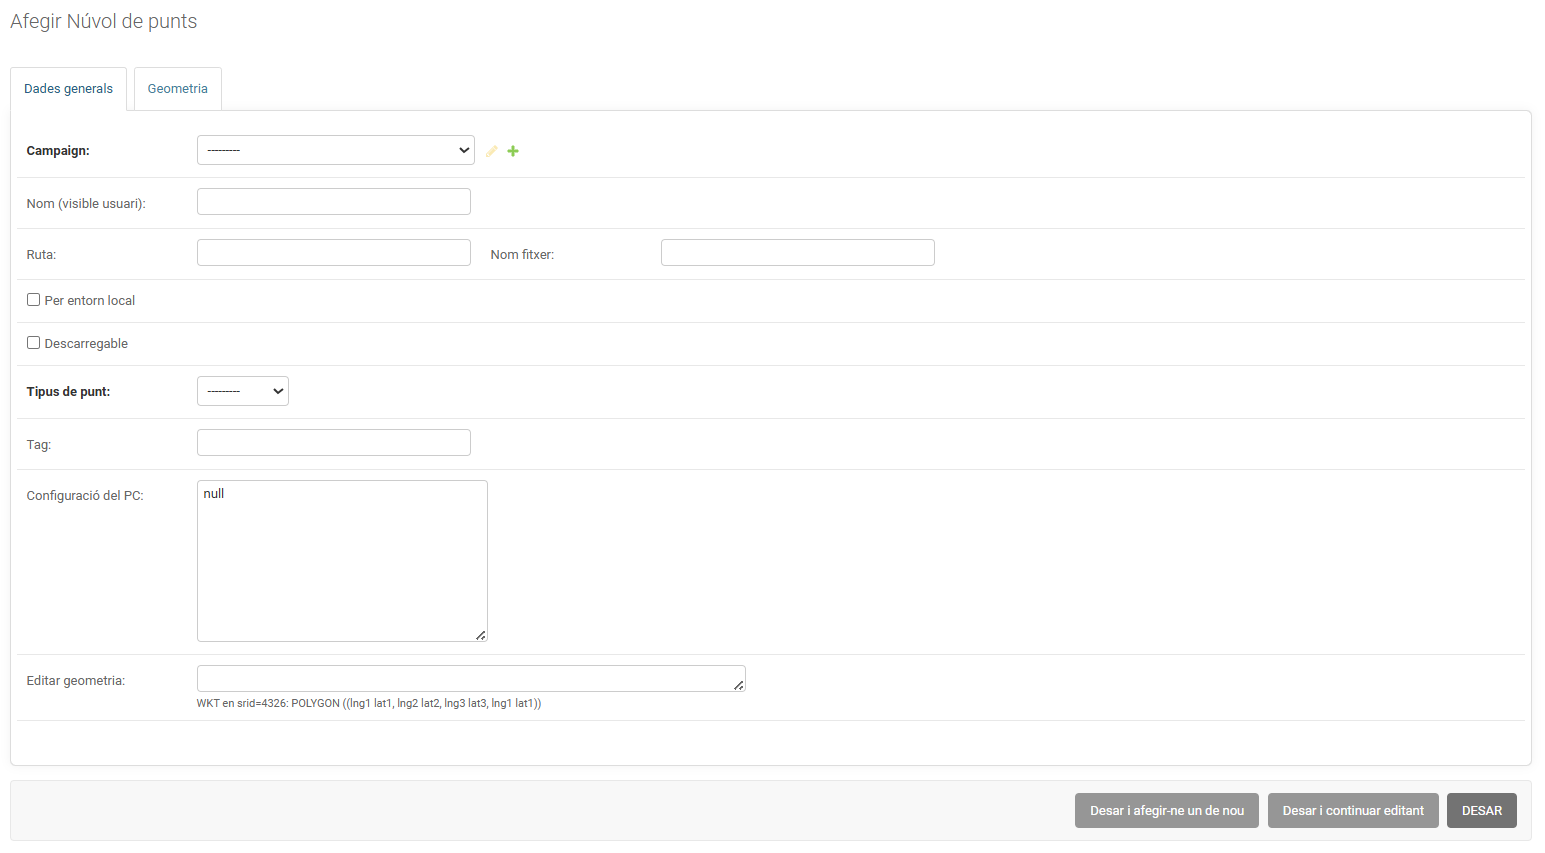
In the Mapia Streets interface, in the load point cloud section, the components are as follows:
- Campaign: Campaign to which the point cloud belongs
- Point Cloud Name: Name of the point cloud layer displayed to the user
- File Name: Point cloud file name. Only the file name. For Potree format v2, it is equivalent to the name of the folder containing the data
- Path: Full or relative path to the campaign’s point cloud
- Local Environment: Indicates if the point cloud is intended for a local environment or not (plugins)
- Downloadable: Whether the point cloud is downloadable or not
- Format: Point cloud file format. Accepted values: POTREE, POTREE2, LAS, POD
- Label: Point cloud label for future classifications or organization
- Additional Configurations: Allows saving point cloud configurations (pc_ini_color, pc_ini_point_size, pc_ini_visible, category, pc_order)
- Geometry: Perimeter of the point cloud. It must be within the corresponding campaign.
The Upload File button is used when there are a large number of files to upload. For more information, contact Mapia.
Points of Interest
POIs (Points of Interest) are the points from which the panoramas (360° photographs) have been taken. To upload this series of panoramas, you need to use the top-right button UPLOAD FILE, which will open the following screen:
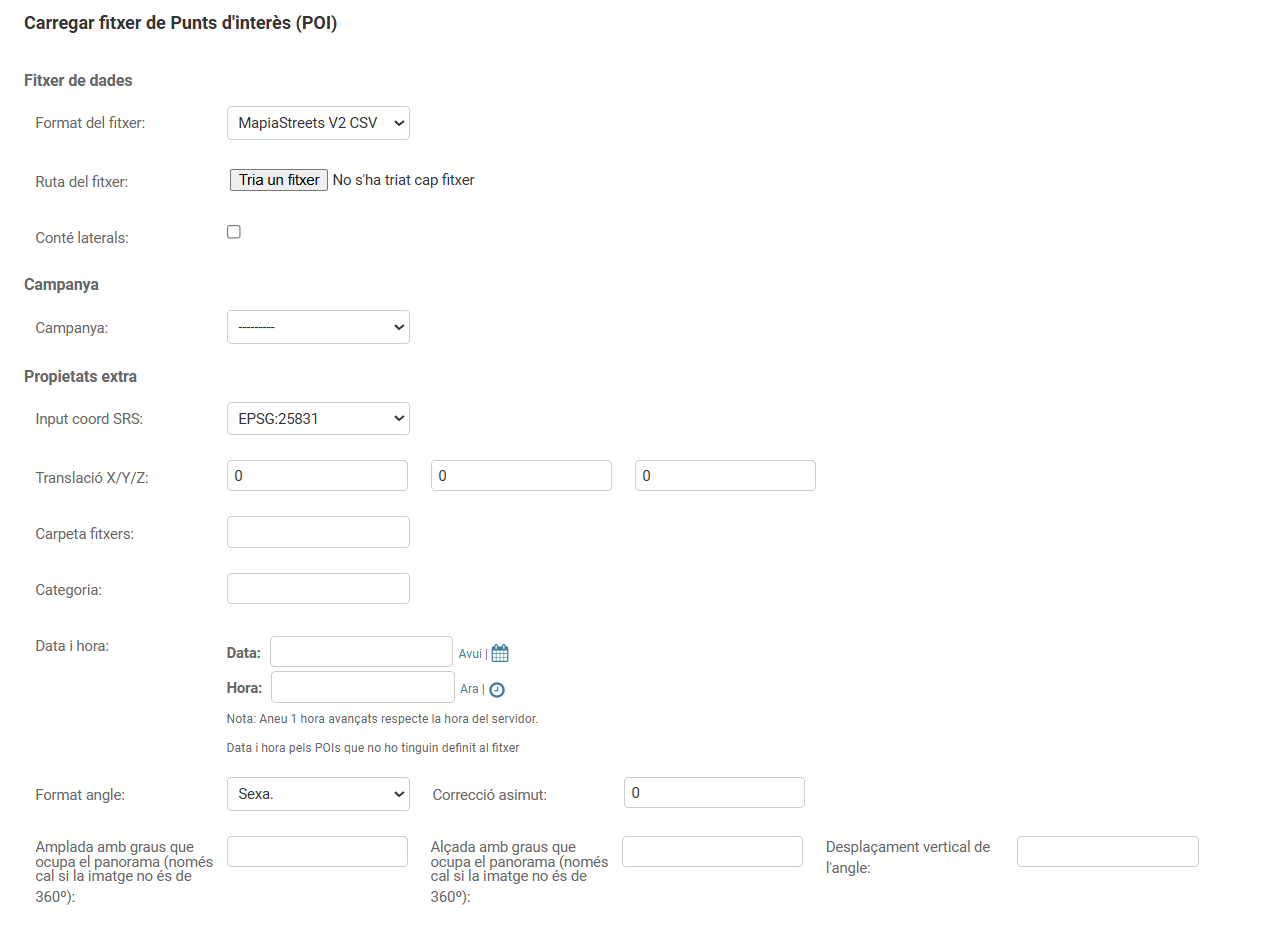
One of the formats that can be used is the MapiaStreetsV3 CSV. This is useful for mobile mapping or static surveys. Its structure is as follows:
Nom Imatge,GPS StandardTime,X,Y,Z Ortometrica,Z Elipsoidal,Omega,Phi,Kappa,Heading,Roll,Pitch,R11,R12,R13,R21,R22,R23,R31,R32,R33,Data,Hora,ID_Tram
1437646982.20_sp_0012.jpg,1437646982.2,342280.016,4669420.518,918.204,969.446,0,0,0,0,0,0,1,0,0,0,1,0,0,0,1,2025-07-27,10:22:44.2,12
1437646980.66_sp_0012.jpg,1437646980.66,342275.097,4669421.203,918.491,969.733,0,0,0,0,0,0,1,0,0,0,1,0,0,0,1,2025-07-27,10:22:42.66,12
1437646979.19_sp_0012.jpg,1437646979.19,342270.172,4669421.967,918.793,970.035,0,0,0,0,0,0,1,0,0,0,1,0,0,0,1,2025-07-27,10:22:41.19,12
1437646977.79_sp_0012.jpg,1437646977.79,342265.254,4669422.883,919.127,970.369,0,0,0,0,0,0,1,0,0,0,1,0,0,0,1,2025-07-27,10:22:39.79,12
1437646976.15_sp_0012.jpg,1437646976.15,342260.443,4669424.21,919.124,970.366,0,0,0,0,0,0,1,0,0,0,1,0,0,0,1,2025-07-27,10:22:38.15,12
1437646974.52_sp_0012.jpg,1437646974.52,342255.656,4669425.423,918.773,970.015,0,0,0,0,0,0,1,0,0,0,1,0,0,0,1,2025-07-27,10:22:36.52,12
1437646973.19_sp_0012.jpg,1437646973.19,342250.733,4669426.085,918.428,969.67,0,0,0,0,0,0,1,0,0,0,1,0,0,0,1,2025-07-27,10:22:35.19,12
1437646984.27_sp_0012.jpg,1437646984.27,342286.262,4669419.286,917.608,968.85,0,0,0,0,0,0,1,0,0,0,1,0,0,0,1,2025-07-27,10:22:46.27,12
1437646985.67_sp_0012.jpg,1437646985.67,342291.065,4669417.928,917.201,968.443,0,0,0,0,0,0,1,0,0,0,1,0,0,0,1,2025-07-27,10:22:47.67,12
1437646987.01_sp_0012.jpg,1437646987.01,342295.731,4669416.202,916.822,968.064,0,0,0,0,0,0,1,0,0,0,1,0,0,0,1,2025-07-27,10:22:49.01,12
1437646988.37_sp_0012.jpg,1437646988.37,342300.385,4669414.394,916.547,967.79,0,0,0,0,0,0,1,0,0,0,1,0,0,0,1,2025-07-27,10:22:50.37,12
1437646989.86_sp_0012.jpg,1437646989.86,342305.256,4669413.307,916.6,967.843,0,0,0,0,0,0,1,0,0,0,1,0,0,0,1,2025-07-27,10:22:51.86,12
In the case of an aerial point cloud, you should upload a geojson with a point set that defines where you want to visualise the LiDAR from Mapia Streets. This should be like the following:
{
    "type" : "FeatureCollection",
    "features" : [
        {
            "type" : "Feature",
            "geometry" : {
                "type" : "Point",
                "coordinates" : [ 3.136007, 42.245518 ]
            },
            "properties" : {
                "pan" : "0",
                "date" : "2026-02-19T12:00:00Z",
                "type" : "PANO",
                "roll" : "0",
                "altitude" : "2.5",
                "filename" : "",
                "pitch" : "0"
            }
        },
        {
            "type" : "Feature",
            "geometry" : {
                "type" : "Point",
                "coordinates" : [ 3.130436, 42.251703 ]
            },
            "properties" : {
                "pan" : "0",
                "date" : "2026-02-19T12:00:00Z",
                "type" : "PANO",
                "roll" : "0",
                "altitude" : "2.5",
                "filename" : "",
                "pitch" : "0"
            }
        }
    ]
}
Of the properties, only the date and the altitude should be changed, which will be the height of the point that will be opened on the Mapia relative to the ground.
Types of Points:
Accepted types of points are as follows:
- PANO: Equirectangular panorama in JPG format
- IMG: An image in JPG/PNG format. Angles do not need to be informed.
- ELEVATION: An elevation point. In this case, there is no document and it does not need to provide route, file name, angles, etc.
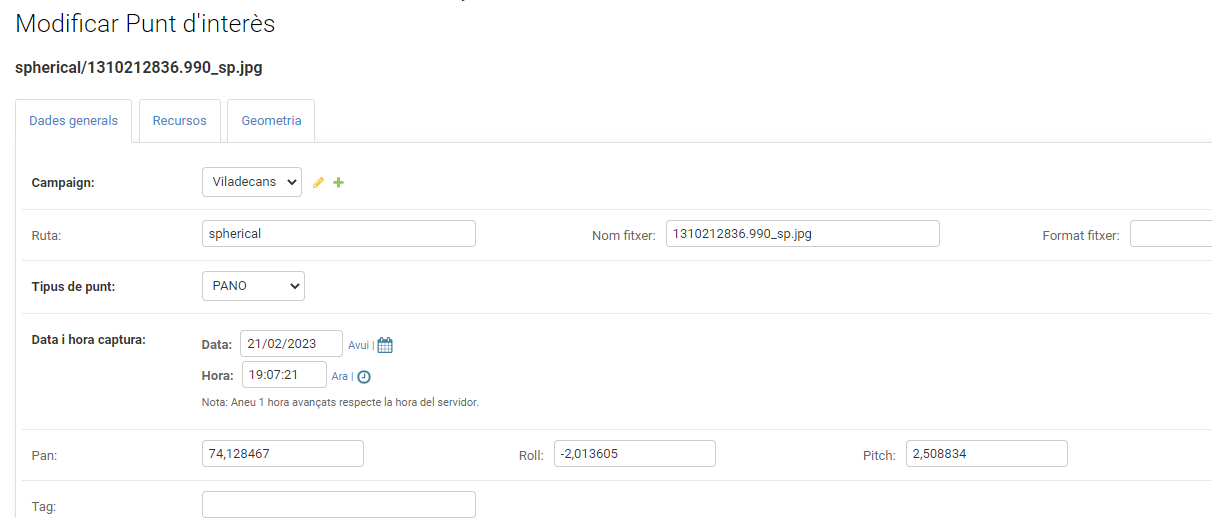
If you wanted to modify a specific point, the interface that opens for us is as follows:
- Campaign: Campaign to which the point cloud belongs
- File Name: Point of interest (POI) file name. Only the file name.
- Format: Associated file format. Accepted values: JPG, PNG
- Type of Point of Interest: Type of point. Accepted values: PANO, IMG, ELEVATION
- Date/Time: Capture date and time
- Point Height: Height (Z) of the POI’s photocenter
- Roll: POI’s roll angle (in sexagesimal degrees)
- Pitch: POI’s pitch angle (in sexagesimal degrees)
- Pan: POI’s pan angle (in sexagesimal degrees)
- Angle width: Horizontal angle covered by the image, default is 360 (in degrees).
- Angle height: Vertical angle covered by the image, default is 180 (in degrees).
- Vertical angle offset: Offset of the vertical angle (in degrees).
- Path: Full or relative path to the campaign’s POI file
- Label: POI label for future classification, organization, or structuring
- Additional Configurations: Allows saving POI configurations (color)
- Geometry: Point with the photocenter of the POI
Trajectories
To visualise the route followed to collect the data, trajectories will be used. These are the union of the different POIs, resulting in a line geometry. They will be stored in the database to be subsequently added to the viewer using QGIS.
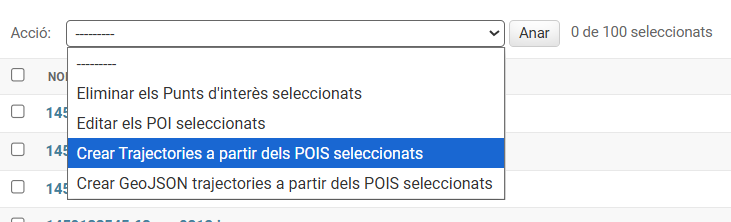
To add the trajectories to the database, use the ‘Create trajectories from selected POIs’ action within the Points of Interest section.
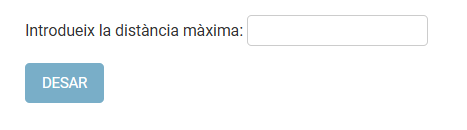
When the action is run, a form will appear asking for the maximum distance. This is the distance at which the programme detects that two points do not belong to the same trajectory and creates a new one. As an example, if a maximum distance of 7 is applied, all the points in the following image would belong to the same trajectory. Conversely, if a distance of 5.7 were applied, only the first two would be within the tolerance.
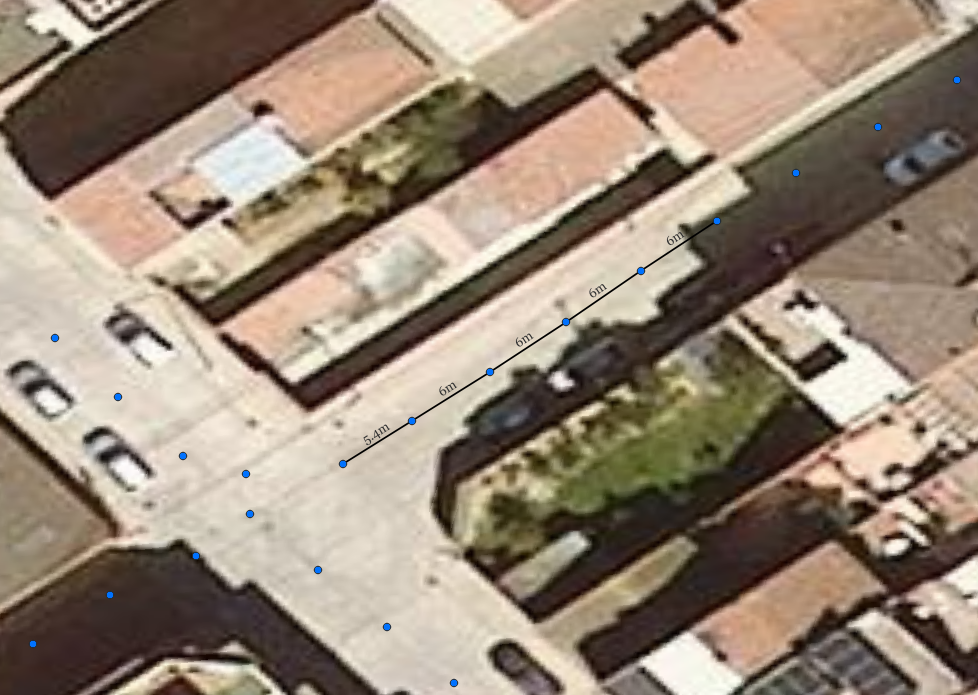
Essentially, the distance will depend on the distance between points.
Fundamentally, the distance will depend on the point spacing for each job. The table below recommends which distance to use for each type of survey.
| Survey Method | Recommended Distance |
|---|---|
Mobile Mapping |
20 metres |
Static |
20 metres |
RTK |
5 metres |
Once the trajectories have been added to the database, a QGIS project should be created from them and uploaded to the Mapia Server. This process is detailed in the following section: Create QGIS project
There is also the option to create a GeoJSON from the POIs. The process is the same, but results in a file that is automatically downloaded. This can be useful if you want to modify the routes manually.
Uploading georeferenced videos
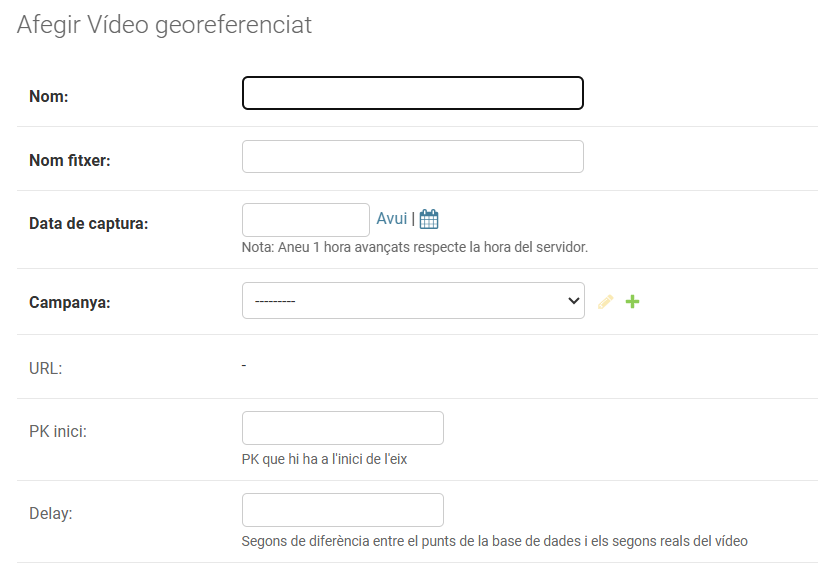
This section will explain the process for uploading a georeferenced video to Mapia Streets. First of all, navigate to the MSTREETS tab, where you will find the Georeferenced Videos section. The Add georeferenced video button is what we will use to add them.
Data
The first section contains the data we will be adding, which includes:
- Name: The name that will appear in the viewer.
- File name: The name of the MP4 video file we have on the server, for example, in FileZilla. It is important that both strings are identical, both on the server and in the file name.
- Capture date: The day the data was captured.
- Campaign: Must be defined beforehand in the corresponding section. In this case, MSTREETS-Campaigns.
- URL: Created after adding the video. It is a URL to the video.
- PK Start: Starting point of the axis.
- Delay: In exceptional cases, a delay can be applied to the video.
Geometry
To georeference the video, we must add a Linestring in the WKT (Well-Known Text) coordinate system. It must follow the following format: LINESTRING (lng1 lat1, lng2 lat2, lng3 lat3, lng1 lat1). Here is a real-world example:
LINESTRING (2.19904512882965 41.4301743942329,2.19921750908082 41.4302169348637,2. 19946540990077 41.4302668886061)
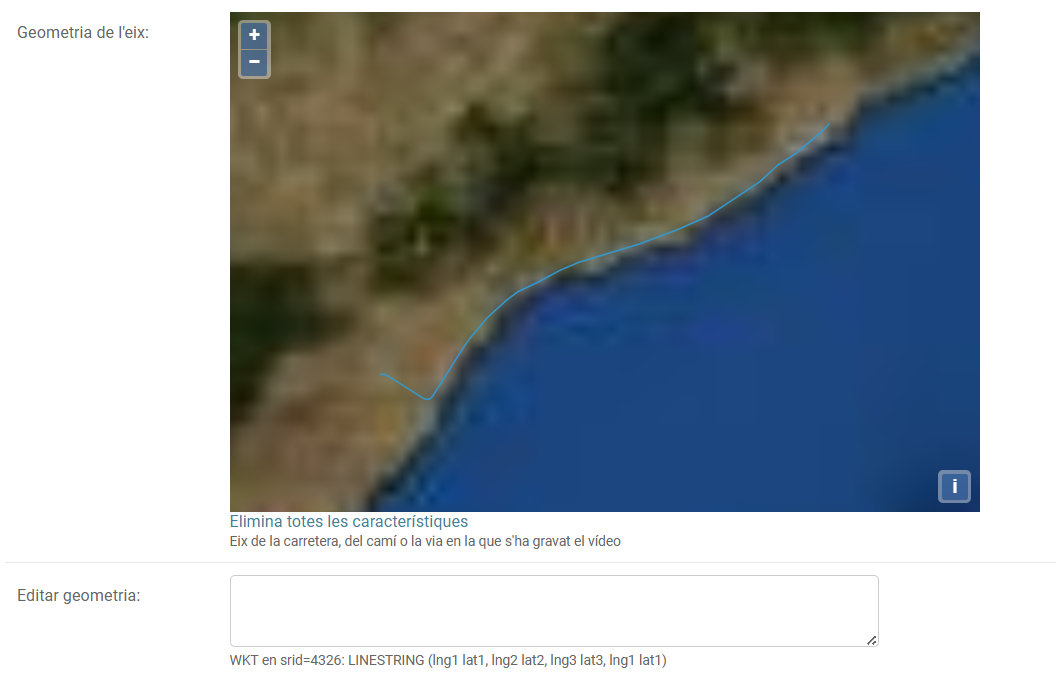
The Linestring must be added to the Edit geometry section, where the geometry will be automatically visualised in the Axis geometry section.
CSV
A CSV file must be attached containing the coordinates for each frame of the video. This data allows each frame to be geolocated precisely by calculating the distance between the initial PK and the elapsed seconds.
- Seconds
- Longitude (using coordinate system 4326)
- Latitude (using coordinate system 4326)
- Z coordinate (optional)
The CSV file must be in the following format:
Temps de video (s),Longitud,Latitud
0,2.673645004355977,41.77051999805678
2,2.6737066723774654,41.77033833063928
4,2.6737333307607942,41.77024167103148
7,2.67376499443733,41.7701283356337
9,2.6737850016123423,41.770038331320556
11,2.6738083342182404,41.76994500384897
13,2.6738266642195097,41.76984167339129
15,2.673836667369809,41.76972667322188
17,2.6738449981422963,41.76961166830173
In the number of points, the total number of coordinates contained in each CSV will be displayed.
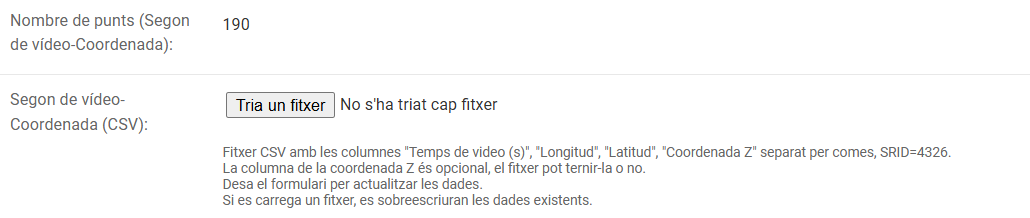
In conclusion, the CSV with coordinates and timestamps is projected onto the axis. The CSV points are then positioned on this axis, which was added using a WKT in LINESTRING format. Each point contains a timestamp field, which will be used to link the video to the axis. Each moment of the video that appears at a coordinate via the temp can be geolocated. It is crucial to mention that trains have non-constant acceleration, so the more points the CSV has correctly measured, the more precise the result will be. The PK is extremely important as the starting point of the axis, since all the others are calculated from it.